Why Many Technical Diagrams Become Outdated
Most diagrams start with good intentions. A developer creates a flowchart to explain how an application works, documents a database structure, or maps out an API workflow for teammates. Everything looks accurate on day one. The problem starts a few weeks later when the project changes. New features are added, services are renamed, APIs evolve, and the diagram is forgotten. Before long, the documentation no longer matches the actual project.
This is one reason many developers have moved away from traditional diagram tools and static screenshots. Updating a visual diagram often means reopening a design file, moving shapes around, exporting a new image, and replacing the old version in the documentation. For small changes, that process feels unnecessary, so updates get postponed. Over time, the diagram becomes outdated and less useful than having no diagram at all.
Mermaid diagrams solve this problem differently. Instead of drawing boxes and arrows manually, you describe the workflow using simple text. When the project changes, you update a few lines of code and the diagram is regenerated instantly. This makes it much easier to keep architecture diagrams, process flows, user journeys, and technical documentation synchronized with the real project.
For developers maintaining GitHub repositories, open-source projects, SaaS applications, or student projects, this approach can save a significant amount of time. Rather than treating diagrams as separate design assets, Mermaid allows them to become part of the documentation itself. The result is documentation that is easier to maintain, easier to review, and far less likely to become outdated as the project grows.
What Can You Create With This Mermaid Diagram Generator?
Diagrams are often used to explain information that would be difficult to understand through text alone. Whether you're documenting a software project, planning a database, mapping an API workflow, or organizing a folder structure, visual diagrams can make complex information easier to follow. Instead of switching between multiple diagram tools, this Mermaid Diagram Generator supports several diagram formats from a single editor, allowing you to create, edit, preview, and export diagrams without leaving your workflow.
The generator is designed for developers, students, technical writers, and project maintainers who need a faster way to create documentation. Since diagrams are generated from editable code rather than manually drawn shapes, updating them is often much quicker when requirements change. Below are the main diagram types supported by the generator and the situations where they are commonly used.
1. Flowcharts
Visualize Processes and Decision Trees
Flowcharts are one of the most popular diagram types because they can explain processes in a simple visual format. They are useful for documenting application workflows, authentication systems, user journeys, onboarding processes, approval systems, and business logic. Instead of describing every step in a long paragraph, a flowchart allows readers to understand the entire process at a glance.
2. ER Diagrams
Document Database Relationships
Entity Relationship diagrams help visualize how database tables connect with each other. Developers commonly use ER diagrams when designing databases, documenting SaaS applications, building backend systems, or explaining project structures to team members. They provide a clear overview of tables, relationships, primary keys, and data organization.
3. Sequence Diagrams
Map API and Service Communication
Sequence diagrams show how different systems interact over time. They are particularly useful for documenting API requests, authentication flows, payment processing systems, notifications, and communication between frontend and backend services. By visualizing requests and responses, sequence diagrams make technical workflows easier to understand.
4. Architecture Flow Diagrams
Explain System Architecture Visually
As projects grow, explaining how different services work together becomes increasingly difficult. Architecture diagrams help document relationships between frontend applications, backend services, databases, cloud infrastructure, and third-party integrations. These diagrams are commonly used in technical documentation, project planning, and GitHub repositories.
5. Gantt Charts
Plan Tasks and Project Timelines
Gantt charts help teams organize tasks, milestones, and project schedules. They provide a visual timeline that makes it easier to track deadlines, monitor progress, and understand dependencies between tasks. Students, project managers, and development teams often use Gantt charts when planning work across multiple stages.
6. ASCII Trees
Generate Text-Based Project Structures
ASCII trees display hierarchical structures using plain text characters. They are frequently used to represent project folders, repository layouts, configuration structures, and documentation hierarchies. Because they work well in markdown files and README documents, ASCII trees are especially popular among GitHub users.
7. Indent Trees
Represent Hierarchical Data Clearly
Indent trees provide another way to visualize nested structures using indentation rather than connecting lines. They are useful for organizing categories, navigation systems, documentation structures, project plans, and other hierarchical information where simplicity is preferred over complex diagrams.
8. JSON Visualizations
Understand Complex JSON Structures Faster
Large JSON files can quickly become difficult to read, especially when working with APIs and configuration data. JSON visualizations transform raw JSON into a structured view that is easier to understand. This can help developers inspect API responses, debug data structures, and document application configurations more effectively.
Because all of these diagram types are created from editable code, they are easier to maintain than traditional image-based diagrams. When a workflow changes, a database evolves, or a project structure is updated, you only need to modify the source code and regenerate the diagram instead of rebuilding it from scratch.
How the Mermaid Diagram Generator Works
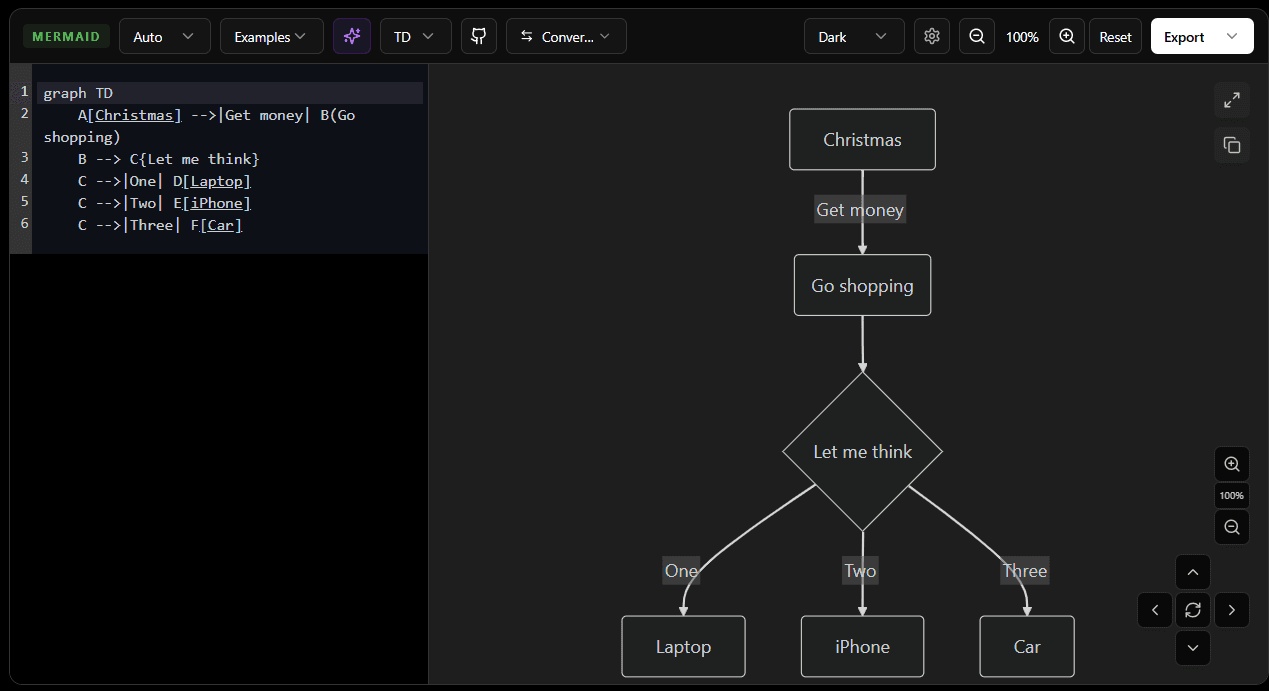
Creating diagrams should not require learning multiple tools or spending time configuring complex software. This Mermaid Diagram Generator is designed around a simple workflow: write or generate diagram code, preview the result instantly, customize the appearance if needed, and export the final diagram in the format that best fits your project. Whether you're documenting a GitHub repository, planning a database structure, or creating technical documentation, the entire process can be completed from a single interface.
The editor includes several features that help both beginners and experienced users work more efficiently. Instead of starting with a blank canvas every time, users can choose examples, generate diagrams with AI, automatically detect diagram types, convert between formats, and preview changes in real time. This reduces the amount of manual work required to create professional-looking diagrams.
Automatically Detect Diagram Types
One common challenge when working with different diagram formats is identifying which format a piece of code belongs to. The generator includes an automatic detection system that analyzes the content and determines the most appropriate format. This helps users avoid configuration mistakes and allows diagrams to render correctly without requiring manual selection every time.
Mermaid Detection
When Mermaid syntax is detected, the editor automatically switches to Mermaid mode and renders the diagram in the preview panel. This makes it easier to work with flowcharts, sequence diagrams, ER diagrams, architecture diagrams, and other Mermaid-supported formats.
JSON Detection
Structured JSON data can be recognized automatically and prepared for visualization. This is useful when documenting API responses, configuration files, or application data structures.
File Tree Detection
The editor can also identify file tree structures and display them in a more organized format. This helps when documenting repository structures, project layouts, and folder hierarchies inside technical documentation.
Start Faster With Built-In Examples
Many users understand what they want to create but are unsure about the syntax required to build it. The built-in example library provides ready-made templates that demonstrate how different diagram types work. Instead of starting from an empty editor, users can load an example, study the structure, and customize it for their own project.
Mermaid Examples
Pre-built Mermaid examples help users learn the basic syntax used to create flowcharts and workflow diagrams.
ER Diagram Examples
Database examples provide a starting point for documenting table relationships and data models.
Sequence Diagram Examples
These examples demonstrate how requests, responses, and service interactions can be visualized over time.
Architecture Flow Examples
Architecture templates show how different systems, services, and infrastructure components can be connected visually.
Gantt Chart Examples
Project planning examples help users understand task scheduling and timeline visualization.
ASCII Tree Examples
Repository and folder structure examples make it easier to document project organization.
JSON Examples
JSON examples provide a simple way to explore how structured data can be represented visually.
Generate Mermaid Diagrams With AI
Not everyone remembers Mermaid syntax, especially when working with complex diagrams. The AI generation feature helps users create a starting point by describing what they want to build in plain language. Instead of manually writing every node and connection, users can generate starter code and refine it as needed.
Describe Your Diagram in Plain English
Simply describe the workflow, architecture, database structure, or process you want to visualize. The AI feature helps transform that description into diagram code that can be edited further inside the generator.
Generate Starter Code Faster
Rather than beginning from a blank editor, users can use AI-generated code as a foundation and make adjustments based on their project requirements.
Convert Between Different Diagram Formats
Projects often require information to be represented in different formats. The built-in conversion tools help transform content between supported structures without requiring users to recreate everything manually.
Convert to Mermaid
Convert supported structures into Mermaid-compatible syntax for visualization and documentation.
Convert to JSON
Transform diagram structures into JSON format for data-driven workflows and integrations.
Convert to ASCII Tree
Generate text-based tree structures that work well in README files, markdown documents, and technical documentation.
Convert to Indented Tree
Convert hierarchical structures into a clean indented format that is easier to read and organize.
Write, Preview, and Refine Diagrams in Real Time
The editor is designed to provide immediate feedback while building diagrams. Instead of saving files and regenerating visuals repeatedly, changes appear instantly inside the preview panel. This allows users to experiment with layouts, structures, and formatting without interrupting their workflow.
Live Code Editor
Write and edit Mermaid code directly within the editor while maintaining full control over the generated diagram.
Instant Diagram Preview
Every change is reflected immediately, making it easier to identify issues and refine the final result.
Zoom Controls
Large diagrams can be inspected more easily using built-in zoom controls that help focus on specific sections of the visualization.
Fullscreen Preview
For complex workflows and large architecture diagrams, fullscreen mode provides a distraction-free view of the final output.
Customize Diagram Appearance
A diagram should not only be correct but also easy to read. Different projects, documentation styles, and audiences often require different visual presentations. A diagram included in a GitHub README may need a compact layout, while a diagram used in technical documentation or presentations may require larger spacing and clearer visual separation. This Mermaid Diagram Generator includes several customization options that allow users to adjust both the appearance and readability of their diagrams without manually editing complex styling code.
Rather than being limited to a single layout or design, users can control diagram direction, themes, borders, spacing, and text behavior directly from the editor. These options help ensure diagrams remain readable whether they are viewed on GitHub, embedded in documentation, shared with teammates, or exported as images.
Choose Diagram Direction
The way information flows through a diagram can significantly affect readability. A simple workflow may work well from top to bottom, while wider system architectures often become easier to understand when displayed horizontally. The generator allows users to change diagram direction depending on the type of information being visualized.
Top to Bottom (TD)
Top-to-Bottom is the most commonly used layout for flowcharts and process diagrams. Information starts at the top and progresses downward through each step. This layout works particularly well for workflows, decision trees, approval processes, and onboarding flows because it follows the natural reading direction used in many documents.
Left to Right (LR)
Left-to-Right layouts are useful when documenting wider workflows, application architectures, and service interactions. Instead of creating a very tall diagram, the information expands horizontally, making better use of available screen space.
Right to Left (RL)
Right-to-Left layouts provide an alternative flow direction that can be useful when documenting specific business processes, reverse workflows, or specialized system diagrams where information naturally moves in the opposite direction.
Bottom to Top (BT)
Bottom-to-Top layouts are less common but can be useful when visualizing growth paths, escalation processes, dependency chains, or hierarchical relationships that build upward through multiple levels.
Switch Between Themes
Different projects often require different visual styles. A diagram used in a GitHub README may need a clean and minimal appearance, while diagrams included in presentations or documentation may benefit from stronger visual contrast. The Mermaid Diagram Generator includes multiple built-in themes that allow users to quickly change the overall look of a diagram without modifying any code.
Changing themes affects node styling, text appearance, background colors, and connection lines. This makes it easy to create diagrams that match your documentation, website design, or personal preferences.
Dark Theme
Dark is the default theme and works especially well with GitHub dark mode, developer portfolios, technical documentation, and modern websites. It provides strong contrast between diagram elements while reducing visual strain during long editing sessions.
Default Theme
The Default theme offers a balanced appearance that works well in general documentation and educational content. It is a good choice when diagrams need to remain readable across different environments and display settings.
Forest Theme
Forest introduces natural green tones that help diagrams stand out while maintaining readability. This theme is often useful for project planning, workflow visualization, educational materials, and presentations where a more distinctive appearance is preferred.
Neutral Theme
Neutral focuses on simplicity and clarity with a clean, professional appearance. It works well for business documentation, architecture diagrams, technical specifications, and situations where minimal visual distraction is important.
Base Theme
Base provides a straightforward foundation that prioritizes content over styling. It is useful when users want a simple diagram that can integrate naturally into existing documentation without drawing excessive attention to visual effects.
Because themes can be changed instantly, users can experiment with different styles and choose the one that best fits their README, documentation site, technical blog, presentation, or project workspace.
Adjust Border Radius
Border radius controls how rounded diagram nodes appear. Smaller values create sharper corners that produce a more technical and structured appearance, while larger values create softer edges that feel more modern and approachable.
Although this may seem like a small adjustment, it can noticeably change the overall visual style of a diagram. Teams often use border radius settings to maintain consistency across documentation and design systems.
Control Line Width
Line width determines how connections between nodes are displayed. Thin lines can make complex diagrams feel cleaner and less crowded, while thicker lines improve visibility when diagrams are viewed on larger screens or exported for presentations.
This setting becomes particularly valuable when working with architecture diagrams, system flows, and large workflow visualizations where connection paths need to remain clearly visible.
Enable Word Wrapping
Long labels are common in technical documentation. Service names, API endpoints, database entities, and business processes often contain more text than a diagram node can comfortably display. Without word wrapping, long labels may overflow, become difficult to read, or force diagrams to grow unnecessarily wide.
The word wrap option automatically breaks long text into multiple lines within the node. This helps maintain a cleaner layout, improves readability, and prevents diagrams from becoming oversized when documenting complex systems.
Together, these customization options allow users to tailor diagrams for different audiences and use cases. Whether the goal is to create a compact diagram for a GitHub README, a professional architecture diagram for documentation, or a presentation-ready workflow chart, the visual controls help ensure the final result remains clear, readable, and visually consistent.
Export Diagrams in Multiple Formats
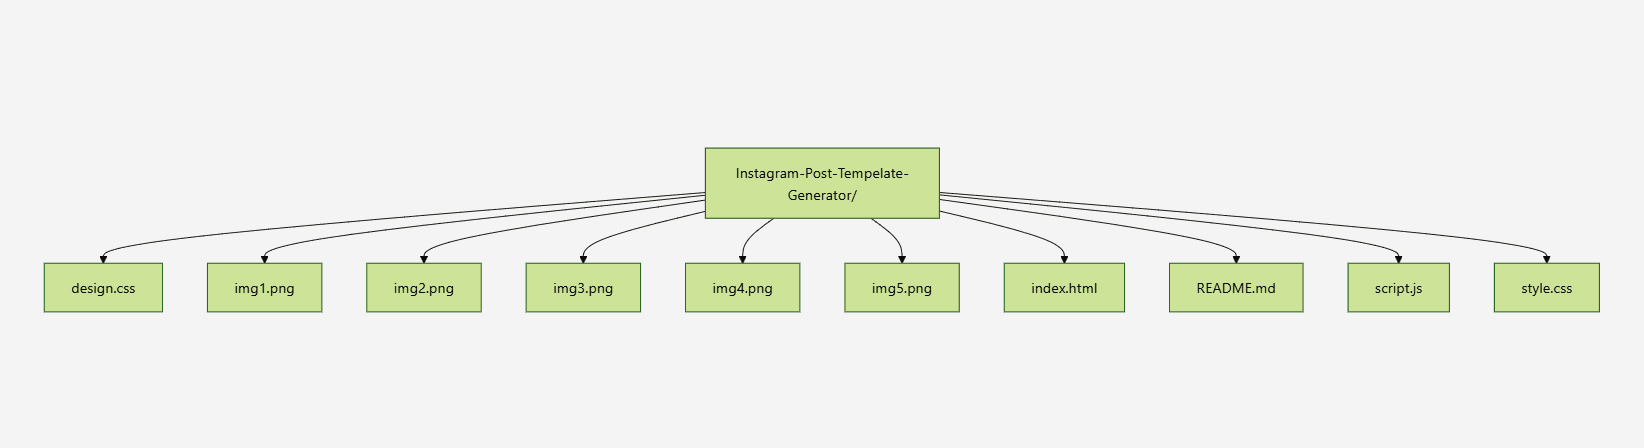
Creating a diagram is only part of the documentation process. Once the diagram is complete, it often needs to be shared with teammates, added to project documentation, embedded in GitHub repositories, included in blog posts, or used in presentations. Different platforms support different file types, which is why the Mermaid Diagram Generator provides multiple export options designed for a variety of workflows.
Instead of forcing users to rely on a single format, the generator allows diagrams to be exported as images, source files, markdown-compatible content, and structured data formats. This flexibility makes it easier to reuse the same diagram across multiple projects without recreating it from scratch.
Export as PNG
PNG export creates a static image that can be shared almost anywhere. It is useful for presentations, documentation websites, reports, tutorials, online courses, and platforms that do not support Mermaid syntax directly.
Because PNG files are widely supported, they are often the preferred choice when sharing diagrams with non-technical audiences who only need to view the final visualization rather than edit it.
Export as SVG
SVG export generates a scalable vector image that remains sharp regardless of screen size or zoom level. Unlike traditional image formats, SVG files can be enlarged without losing quality, making them ideal for modern websites, technical documentation, GitHub repositories, and high-resolution displays.
SVG is particularly useful for developers because the file size is often smaller than equivalent image formats while maintaining excellent visual quality.
Export as Mermaid File
Exporting as a Mermaid file preserves the original diagram source code. This allows users to reopen, edit, and maintain diagrams later without rebuilding them from scratch.
For long-term documentation projects, Mermaid source files are often the most valuable export option because they keep diagrams fully editable as projects evolve over time.
Export as ASCII Tree
ASCII Tree export converts diagram structures into text-based tree representations. These trees are commonly used in project documentation, repository structure guides, terminal output examples, and GitHub README files.
Because ASCII trees use plain text characters, they work well in markdown environments and can be viewed without requiring image rendering support.
Export as Markdown
Markdown export makes it easier to integrate diagrams directly into documentation workflows. Developers can include the exported content in README files, project documentation, knowledge bases, tutorials, and technical blogs without additional formatting work.
This option is particularly useful for teams that manage documentation using markdown-based systems such as GitHub, GitLab, and static site generators.
Export as JSON
JSON export provides a structured representation of the diagram data. This format is useful for integrations, automation workflows, data processing, configuration management, and applications that need to consume diagram information programmatically.
Developers working with APIs, documentation tools, or custom applications can use JSON exports to move diagram data between systems while maintaining a structured format.
By supporting multiple export formats, the Mermaid Diagram Generator adapts to a wide range of documentation and development workflows. Whether you need a presentation-ready image, editable source code, markdown documentation, or structured data, you can export the format that best fits your project without rebuilding the diagram for each use case.
Using Mermaid Diagrams in GitHub README Files
A GitHub README is often the first thing visitors see when they open a repository. While text can explain a project, diagrams help readers understand workflows, system architecture, database relationships, and application logic much faster. This is one reason Mermaid diagrams for GitHub README files have become increasingly popular among developers and open-source maintainers.
Instead of creating screenshots in external design tools, Mermaid allows diagrams to be generated directly from code. This makes documentation easier to maintain because updates can be made by editing a few lines of diagram syntax rather than recreating an image from scratch.
Document Project Workflows
Many repositories contain setup processes, deployment steps, user flows, and development workflows that can be difficult to explain using text alone. A Mermaid flowchart helps readers understand the sequence of actions quickly and reduces confusion for contributors and new users.
For example, open-source projects often use flowcharts to explain contribution workflows, issue reporting processes, pull request reviews, and release pipelines.
Visualize Application Architecture
Modern applications frequently include multiple services such as frontend frameworks, backend APIs, databases, authentication providers, and third-party integrations. Architecture diagrams help developers understand how these components work together without reading hundreds of lines of documentation.
Including architecture diagrams directly inside a GitHub README makes technical documentation easier to consume and provides a clearer overview of the project's structure.
Explain API and Database Relationships
Projects that expose APIs or manage complex databases often benefit from visual documentation. Sequence diagrams can demonstrate request flows between services, while ER diagrams can show relationships between tables and entities.
These diagrams help developers onboard faster because they can understand how data moves through the application before diving into the source code.
Create Better Open Source Documentation
Good documentation can significantly improve the experience of users and contributors. Adding diagrams to README files makes repositories feel more professional, easier to navigate, and easier to understand.
For maintainers, Mermaid diagrams also reduce maintenance work because documentation can evolve alongside the project instead of relying on outdated screenshots.
Build a More Complete GitHub README
Mermaid diagrams work especially well when combined with other README elements such as project descriptions, installation guides, feature lists, file structures, and repository statistics.
If you're building a complete GitHub profile or project README, you can also use our README Generator, Dynamic GitHub File Tree, GitHub Stats Cards, and LeetCode Stats Cards to create documentation that is both informative and visually engaging.
By combining visual diagrams with clear written documentation, developers can create README files that help visitors understand projects faster, improve onboarding, and make repositories easier to explore.
Common Mermaid Diagram Use Cases
Most people do not search for a Mermaid Diagram Generator because they want to learn Mermaid syntax. They usually have something they need to explain visually. It might be a workflow, a database design, a project structure, or an API process that has become difficult to describe using text alone.
A diagram helps people understand relationships, processes, and structures much faster. Instead of reading several paragraphs, readers can see how everything connects in a single view. This is why Mermaid diagrams are widely used in software projects, technical documentation, educational content, and engineering teams.
API Request Flows
When an application communicates with multiple services, understanding the flow of requests can become difficult. Sequence diagrams help visualize how users, frontend applications, APIs, databases, and external services interact. This makes debugging, onboarding, and documentation much easier.
Database Design
As applications grow, database relationships become harder to understand from table definitions alone. ER diagrams provide a clear visual representation of entities, relationships, primary keys, and data structures, making them useful during both development and maintenance.
System Architecture
Many projects include multiple services such as web applications, APIs, databases, authentication providers, cloud infrastructure, and third-party integrations. Architecture diagrams help explain how these components work together and provide a high-level overview of the system.
Project Planning
Flowcharts and Gantt charts are often used to organize tasks, map business processes, visualize approval workflows, and plan project timelines. They help teams understand dependencies and track progress more effectively.
Repository Structures
Sometimes the goal is not to visualize a workflow but to show how a project is organized. In these situations, a file tree is often easier to understand than a flowchart. Developers frequently include repository structures in GitHub README files to help contributors quickly locate important folders and files.
If you need to generate repository structures, export ASCII trees, or create markdown-friendly folder layouts, you can use the File Tree Export Tool. It is designed specifically for documenting project structures and works well alongside Mermaid diagrams.
For repositories that change frequently, the Dynamic GitHub File Tree can automatically display the latest folder structure without requiring manual updates after every commit.
The best visualizations are usually the simplest ones. Use Mermaid diagrams when you need to explain how something works, and use file trees when you need to show how a project is organized. Together they provide a much clearer picture of a project than text alone.